You can use Merge Reports when you need to access data across multiple subject areas.
A very common use case is to find out if the actual time worked on the site was more or less than the scheduled time:
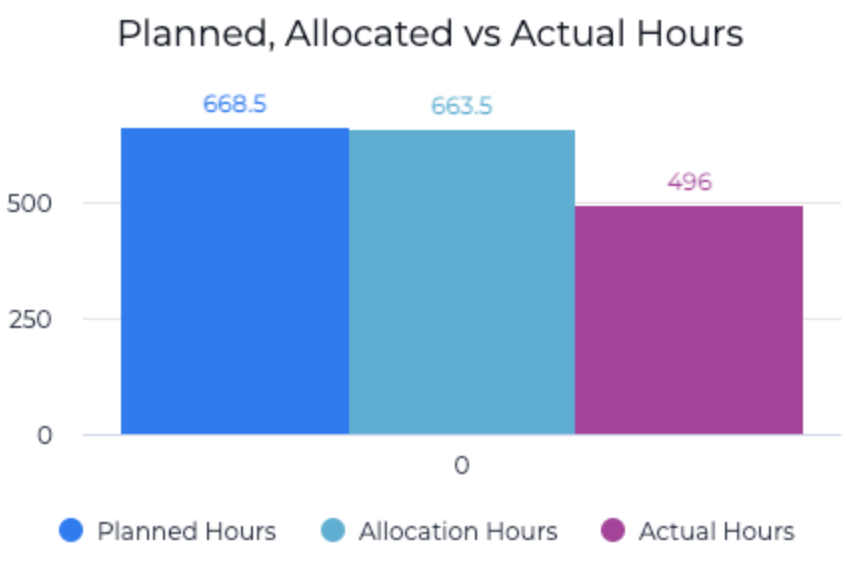
The figure above shows the number of hours planned, allocated and actually worked for a project.
To create this diagram, you select the Assignment subject area and pull the columns required for the report.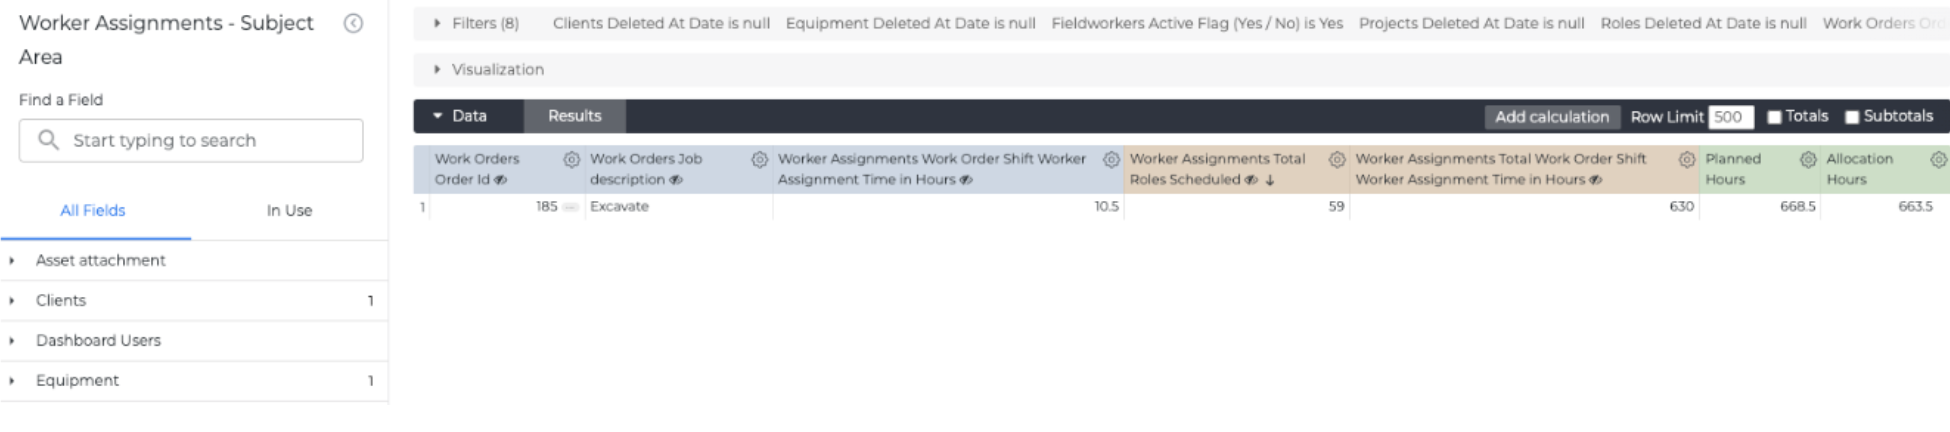
Then you need to perform a Merge Results operation: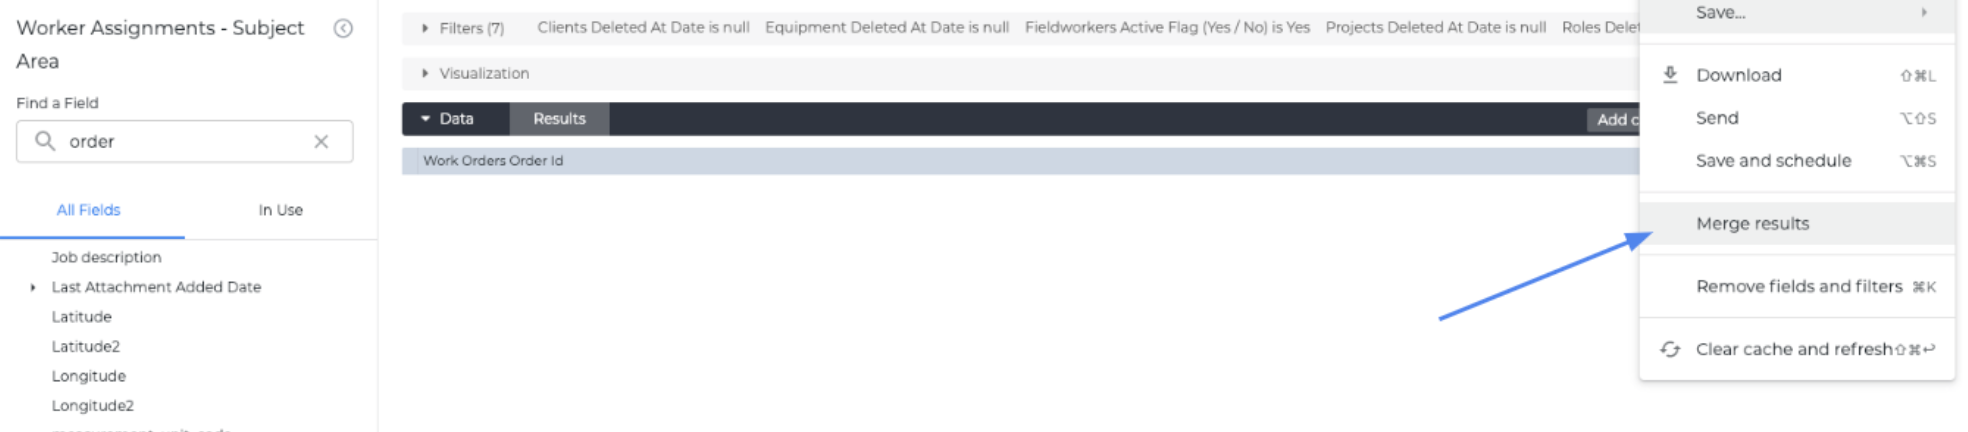
This will open up a new Explore, and you will be asked to choose another Subject area:
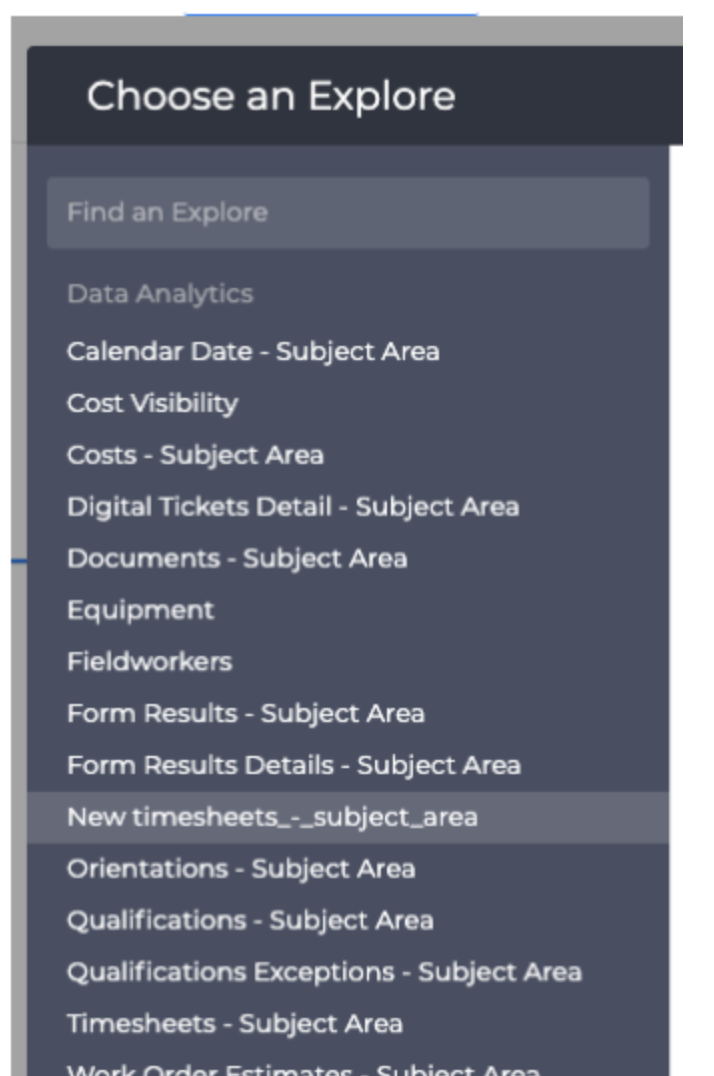
In this example, select Timesheets to add the data points that you want from timesheets area: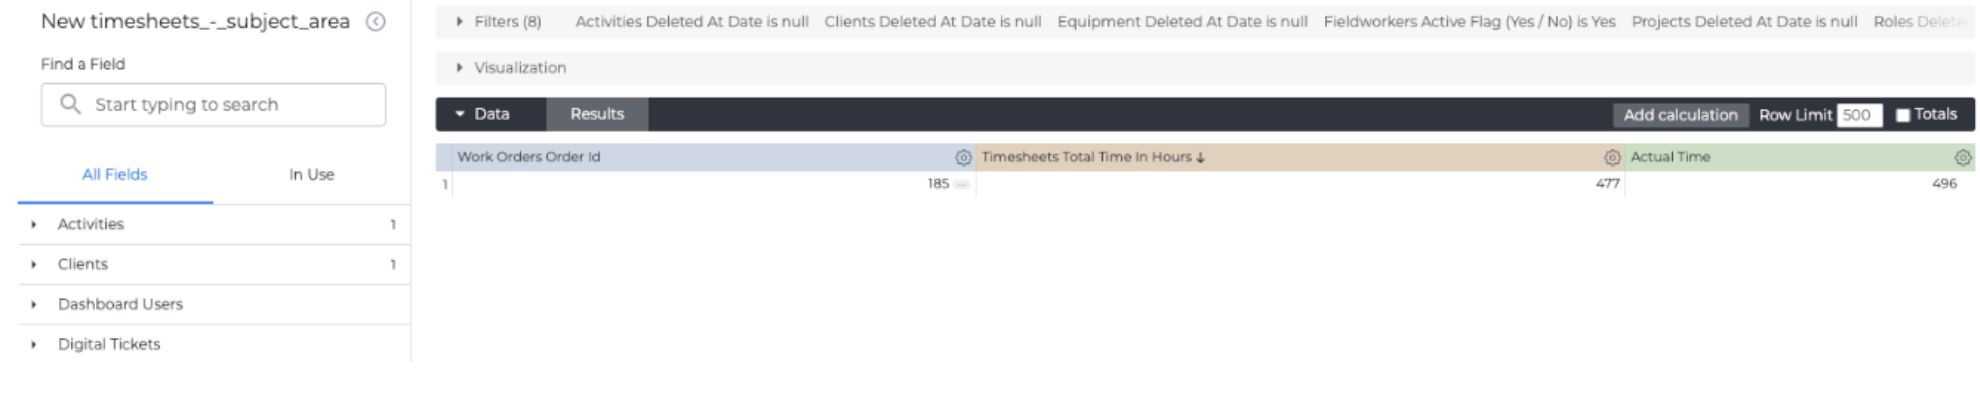
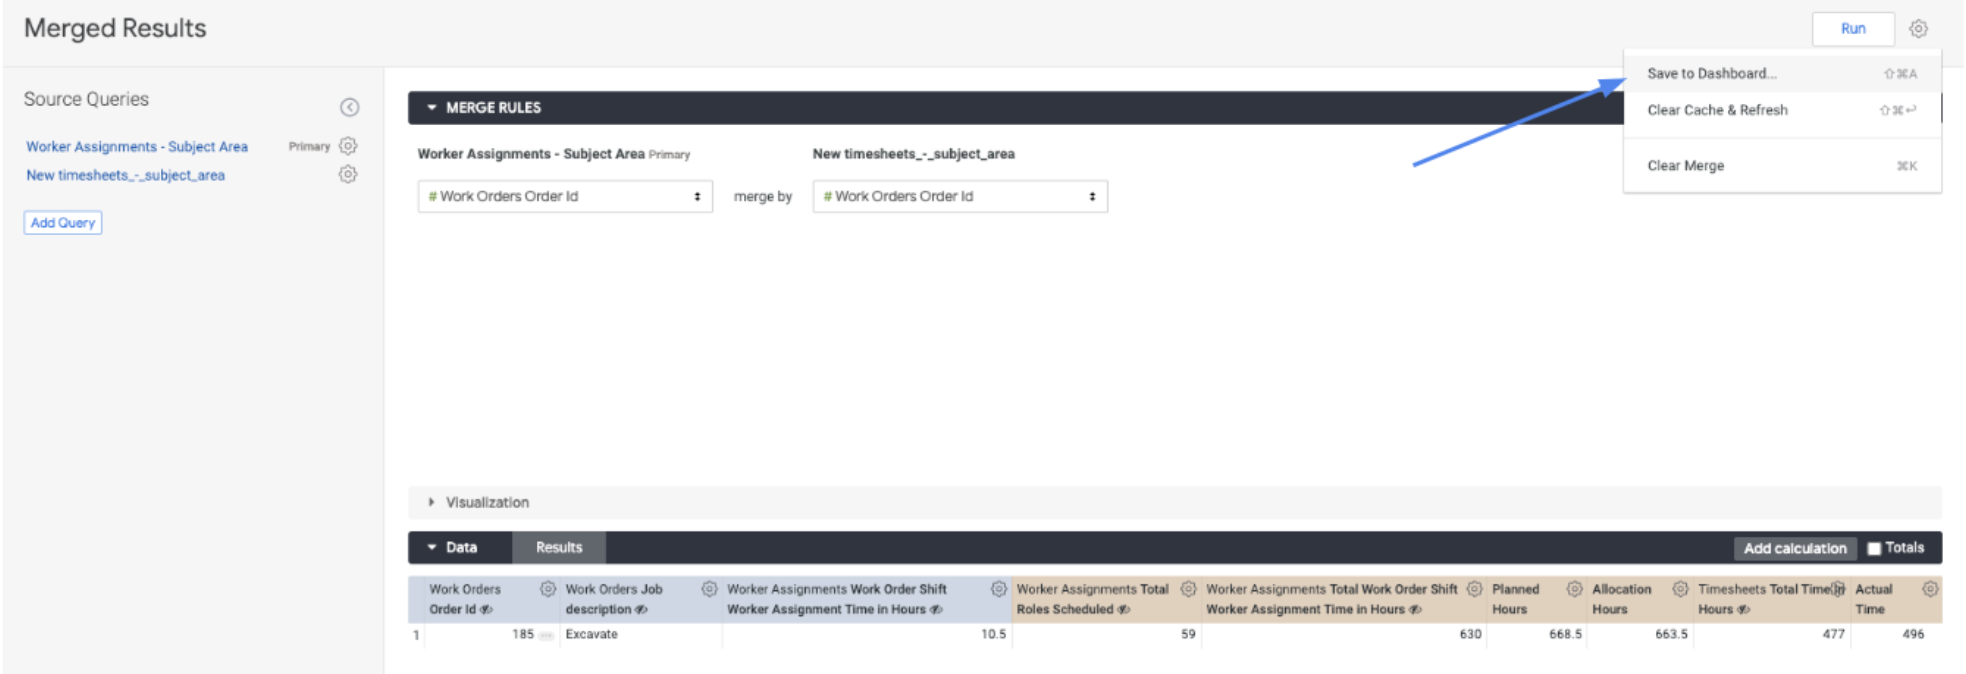
Once you save this, you can merge the 2 datasets using this screen: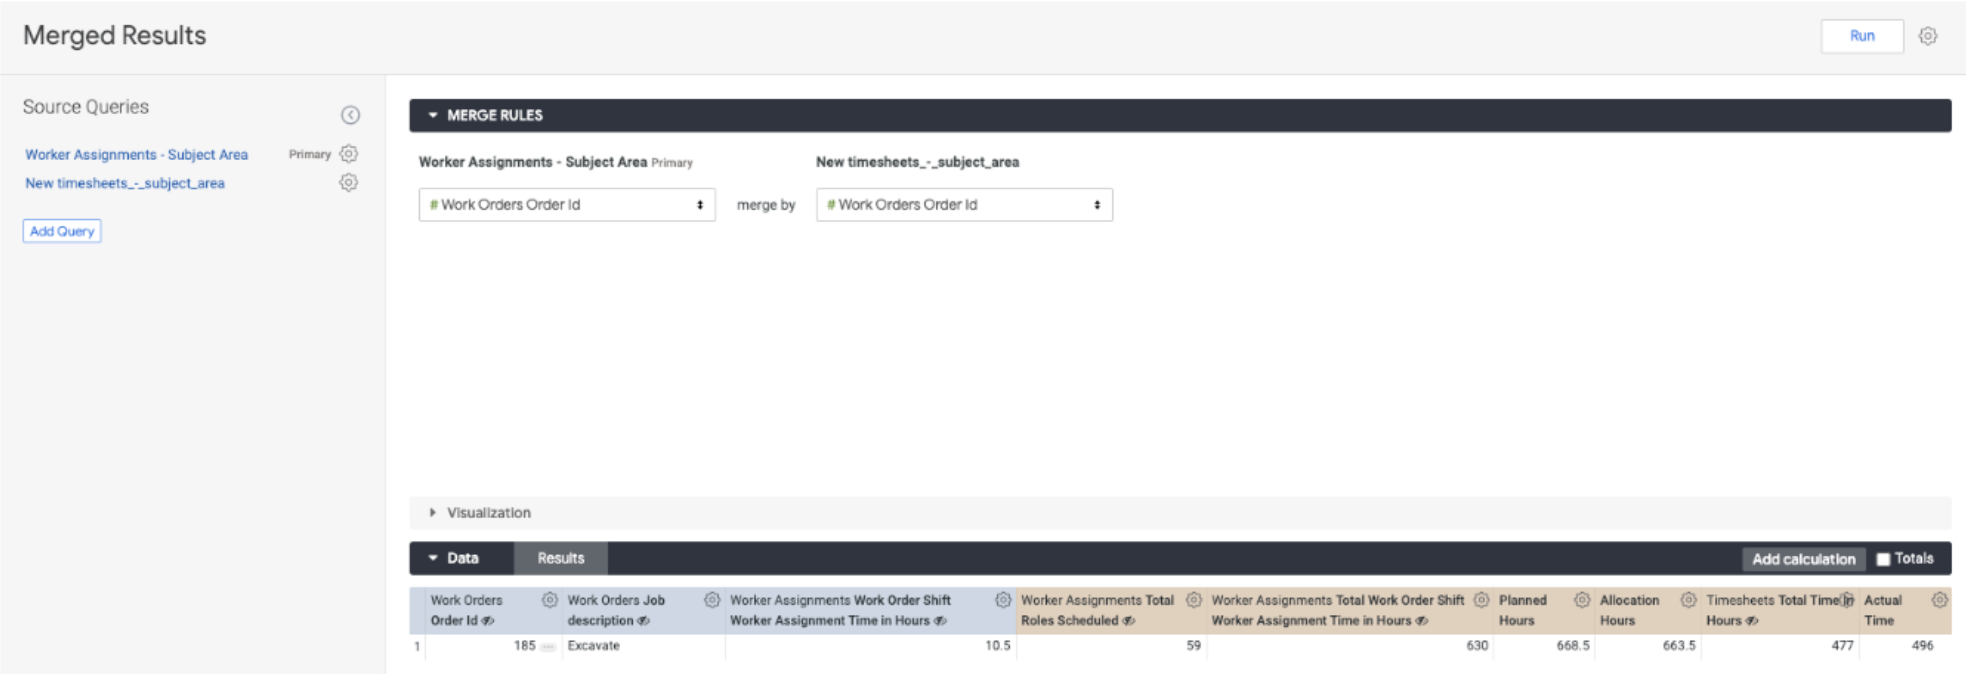
Important note: both these datasets should have a common data point to connect with each other. In the example, order_id or assignment_id is the common data point to join the report from assignments and timesheets.
Once you are ready with the merged report you can now save it to the desired dashboard.